What Are Technical Indicators?
Technical indicators are formulas or algorithms applied to price and volume data on a chart. They help traders visualize patterns and signals that may not be obvious from price alone. Indicators fall into several categories, such as trend-following, momentum, and volatility.1. RSI (Relative Strength Index)
RSI measures the strength and speed of recent price changes. It ranges from 0 to 100.
- An RSI above 70 suggests an asset may be overbought, meaning it could be due for a pullback.
- An RSI below 30 suggests the asset may be oversold, possibly indicating a buying opportunity.
Use RSI to spot trend exhaustion or possible reversals. However, during strong uptrends or downtrends, RSI can stay in overbought or oversold territory for a long time.
2. Moving Averages (SMA & EMA)
Moving averages smooth out price data to identify the overall trend.- SMA (Simple Moving Average): Average price over a set period
- EMA (Exponential Moving Average): Gives more weight to recent prices
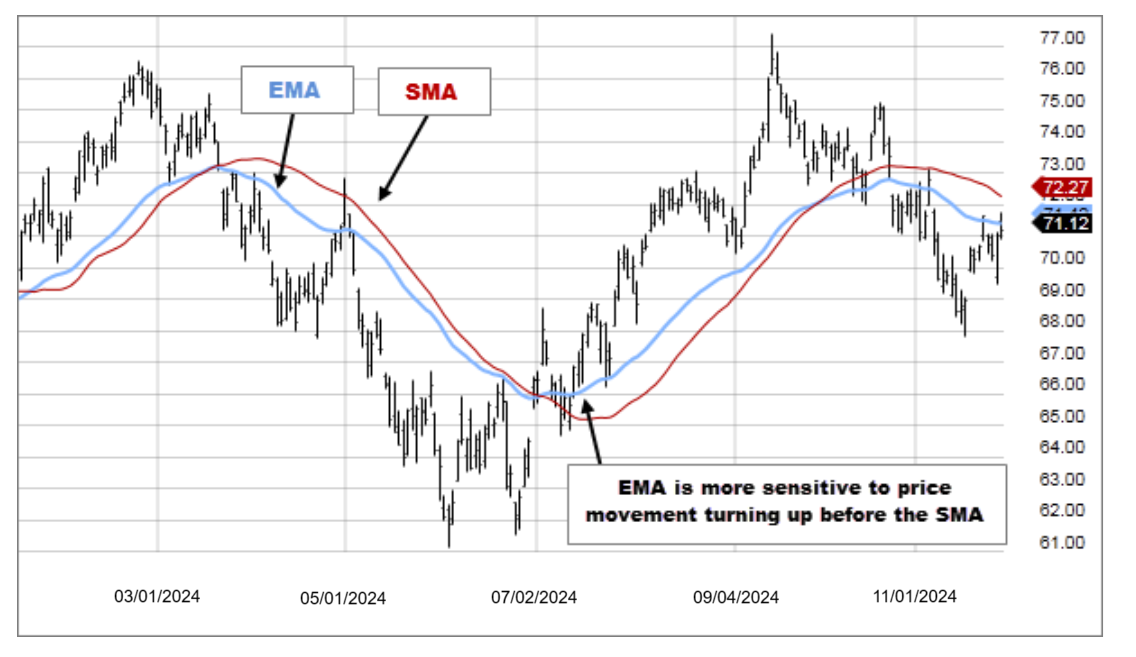
Traders often use the 50-day and 200-day moving averages:
- If price is above the 200-day MA, it’s generally bullish.- A “golden cross” happens when the 50-day MA crosses above the 200-day — a potential buy signal.
- A “death cross” is the opposite, often viewed as bearish.
Traders often use the 50-day and 200-day moving averages:
- If price is above the 200-day MA, it’s generally bullish.- A “golden cross” happens when the 50-day MA crosses above the 200-day — a potential buy signal.
- A “death cross” is the opposite, often viewed as bearish.
3. MACD (Moving Average Convergence Divergence)
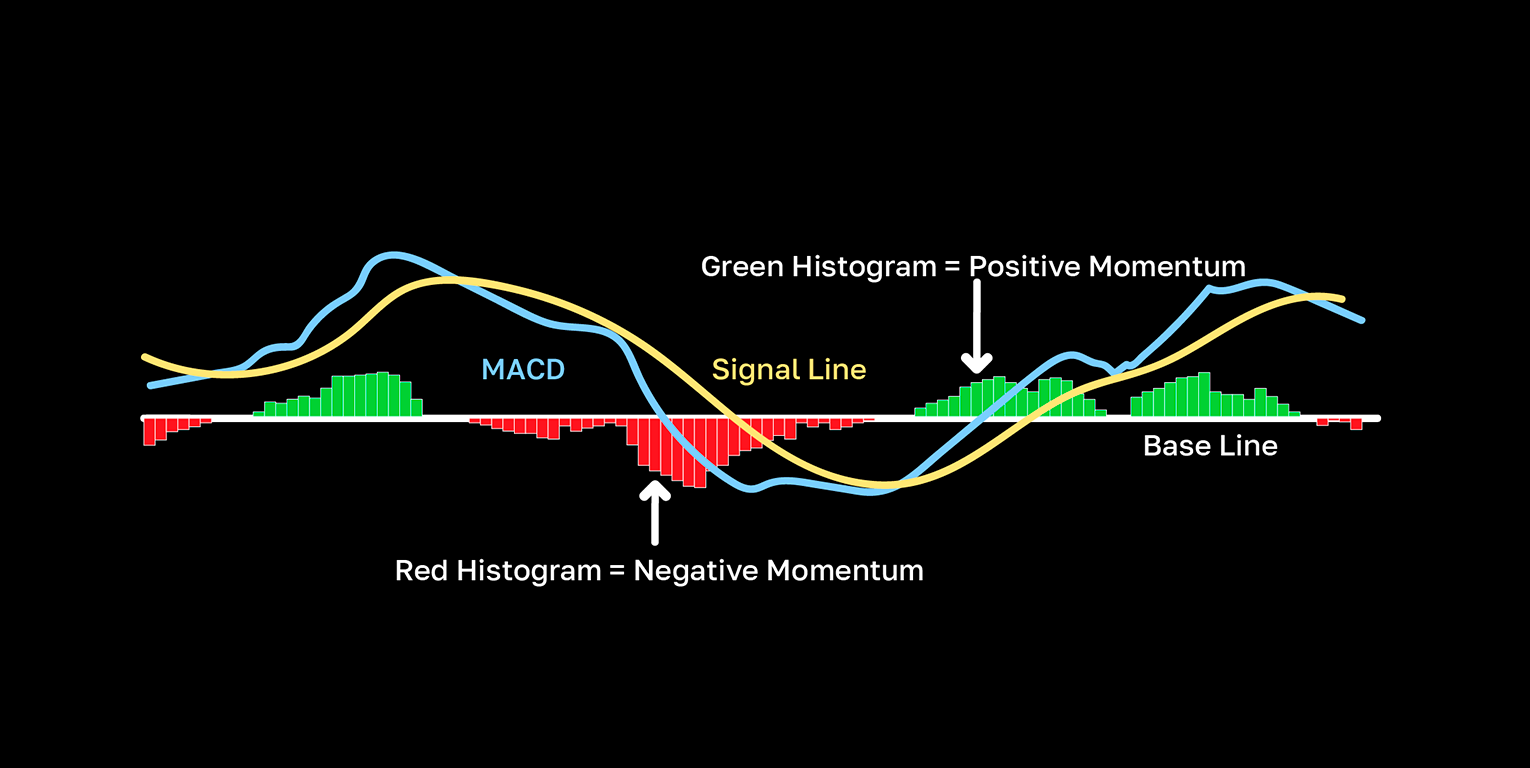
MACD is a trend-following and momentum indicator. It compares two moving averages (usually the 12-day and 26-day EMA) and generates a signal line.
Key components:
-MACD Line: The difference between short- and long-term EMAs
-Signal Line: A 9-day EMA of the MACD line
-Histogram: Shows the gap between the MACD and signal lines
4. Volume
Volume shows how much of an asset is traded during a period. High volume often confirms the strength of a price move.- If price rises on strong volume, the trend may continue.
- If price moves on low volume, it may lack conviction.
Volume spikes can also signal breakouts or fakeouts.
How to Use Indicators Together
No indicator should be used alone. Combining multiple tools can improve accuracy.For example:
1. Use RSI to spot overbought/oversold levels.
2. Confirm direction with MACD.
3. Watch volume to confirm breakout strength.
Notes:Always check the overall trend before acting on a signal. Indicators work best in context.
How to Use Indicators Together
No indicator should be used alone. Combining multiple tools can improve accuracy.For example:
1. Use RSI to spot overbought/oversold levels.
2. Confirm direction with MACD.
3. Watch volume to confirm breakout strength.
Notes:Always check the overall trend before acting on a signal. Indicators work best in context.
Limitations and Risks
Technical indicators are not magic. They react to past price data and may give false signals. In sideways or choppy markets, many indicators can be misleading.Also, indicators lag behind the market — especially moving averages. Always combine indicators with price action and risk management.
Disclaimer
This article is for informational purposes only and does not constitute financial, legal, or investment advice. Cryptocurrencies are subject to market risk and volatility. Please consult a qualified advisor before making any investment decisions.© 2025 CoinByte. Some content in this article may have been adapted or generated with the assistance of AI tools.
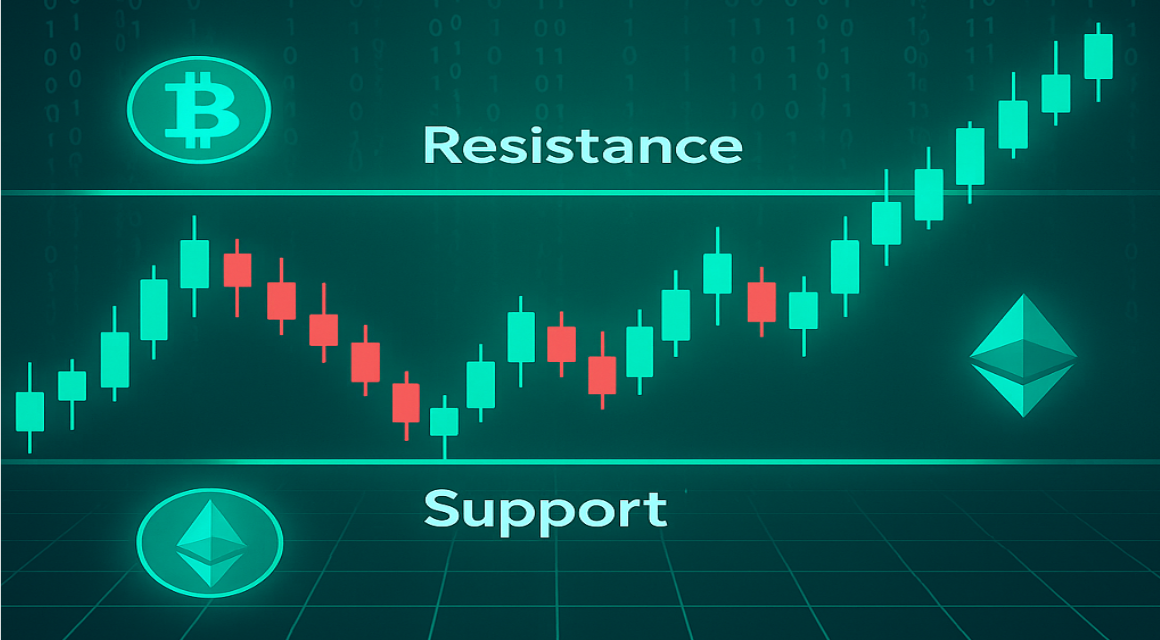 Trading IdeasHow to Identify Support and Resistance Levels in Crypto ChartsSupport and resistance help traders spot price zones where crypto assets are likely to pause, bounce, or reverse.
 Trading IdeasDollar-Cost Averaging (DCA): Recurring BuyWhat Is Dollar-Cost Averaging (DCA)?cryptocurrency can be intimidating, especially with its high volatility. One proven strategy to manage risk and build long-term positions is Dollar-Cost Averaging (DCA). DCA is an investment strategy where you divide your total investment into smaller, fixed amoun
 Trading IdeasTradingView for CryptoTo learn how to use CoinByte's TradingView and it's tools.