Why CoinByte Integrates TradingView
CoinByte’s TradingView module combines the power of real-time charting with a simplified user experience. While TradingView is widely known for its robust tools, many platforms overload the interface with distracting features. At CoinByte, we focus on clarity, speed, and precision — perfect for both beginners and experienced traders.
(Insert Screenshot)
1. Interface Overview: Clean, Efficient
The CoinByte charting layout is designed for easy navigation:
- Top Panel: Shows price details like current rate, 24h high/low, and change %.
- Left Toolbar: Contains drawing tools — trend lines, pitchforks, shapes, annotations.
- Bottom Panel: Volume data and order history tabs.
- Right Panel (Hidden by default): Can be toggled to show price alerts, news, and more.
(Insert Screenshot)
2. Chart Timeframes & Display Options
At the top of the chart, users can toggle between:
- Timeframes: From 1 minute to 1 day (1m, 5m, 1h, 1D, etc.)
- Indicators Menu: Add TA tools like RSI, MACD, Bollinger Bands
- View Toggles: Switch to depth chart or order book (top right)
(Insert Screenshot)
3. Drawing Tools: Trendlines, Pitchforks, and More
CoinByte provides all the core TradingView drawing tools directly on the left-side menu. These include:
- Trend Line: For identifying uptrends and downtrends.
- Arrow and Ray Tools: Highlight breakouts or support levels.
- Pitchfork: Advanced tool for parallel trend channels.
- Brush/Text/Icons: For marking up charts or taking visual notes.
(Insert Screenshot)
4. How to Add Indicators
Indicators are the backbone of technical analysis. With CoinByte’s integrated TradingView, you can easily:
1.Click "Indicators" on the top toolbar.
2. Search for and select the desired TA tool (e.g., RSI, MACD).
3. The indicator appears below or overlaid on the chart.
Common indicators to start with:
- RSI (Relative Strength Index): Identifies overbought/oversold zones.
- MACD: Highlights momentum and potential reversals.
- Bollinger Bands: Great for volatility and breakout spotting.
- Moving Averages: Helps smooth short-term price noise.
(Insert Screenshot)Adding RSI to a CoinByte chart
You can add multiple indicators and adjust their inputs (e.g., periods) to suit your strategy.
5. Using the Volume Panel & Order History
Beneath the chart, you’ll find the Volume panel — essential for confirming breakout strength or trend sustainability. Right below, toggle between:
- Open Orders: View active limit or market orders.
- Order History: Audit past executions tied to the asset you're charting.
(- Insert Screenshot: Volume bars and open orders highlighted)
This live connection between visual data and trading activity is ideal for scalpers and short-term traders who want immediate feedback.
6. Tips for Beginners
- Start with 1–2 indicators. RSI + MA is a strong combo.
-Learn to draw trendlines to spot entry/exit zones.
-Use volume confirmation before acting on signals.
-Save chart layouts to track your favorite assets (for registered users).
Disclaimer
This article is for informational purposes only and does not constitute financial, legal, or investment advice. Cryptocurrencies are subject to market risk and volatility. Please consult a qualified advisor before making any investment decisions.
© 2025 CoinByte. Some content in this article may have been adapted or generated with the assistance of AI tools.
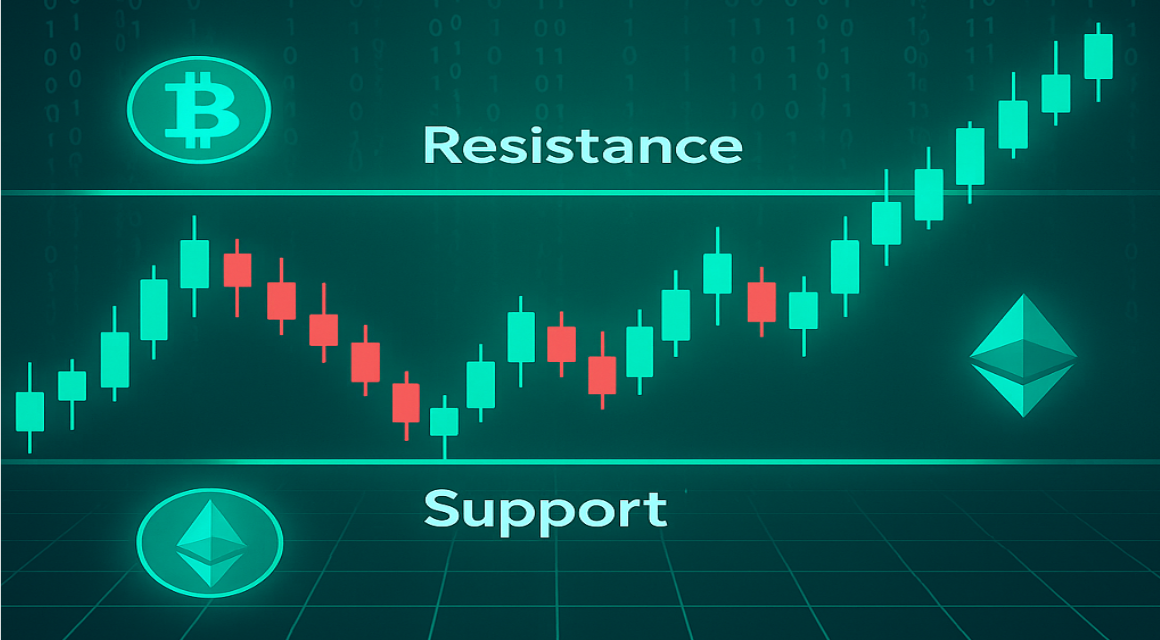 交易思路How to Identify Support and Resistance Levels in Crypto ChartsSupport and resistance help traders spot price zones where crypto assets are likely to pause, bounce, or reverse.
 交易思路Dollar-Cost Averaging (DCA): Recurring BuyWhat Is Dollar-Cost Averaging (DCA)?cryptocurrency can be intimidating, especially with its high volatility. One proven strategy to manage risk and build long-term positions is Dollar-Cost Averaging (DCA). DCA is an investment strategy where you divide your total investment into smaller, fixed amoun
 交易思路Market Orders vs. Limit Orders: Which Should You Use?When trade cryptocurrency in CoinByte, one of the first choices you’ll face is whether to place a market order or a limit order. 1. What Is a Market Order? A market order tells the exchange to buy or sell a crypto asset immediately at the current best available price.- Market buy order: you purchase f